Kaizen - Global Trade Solutions Dashboard
Description
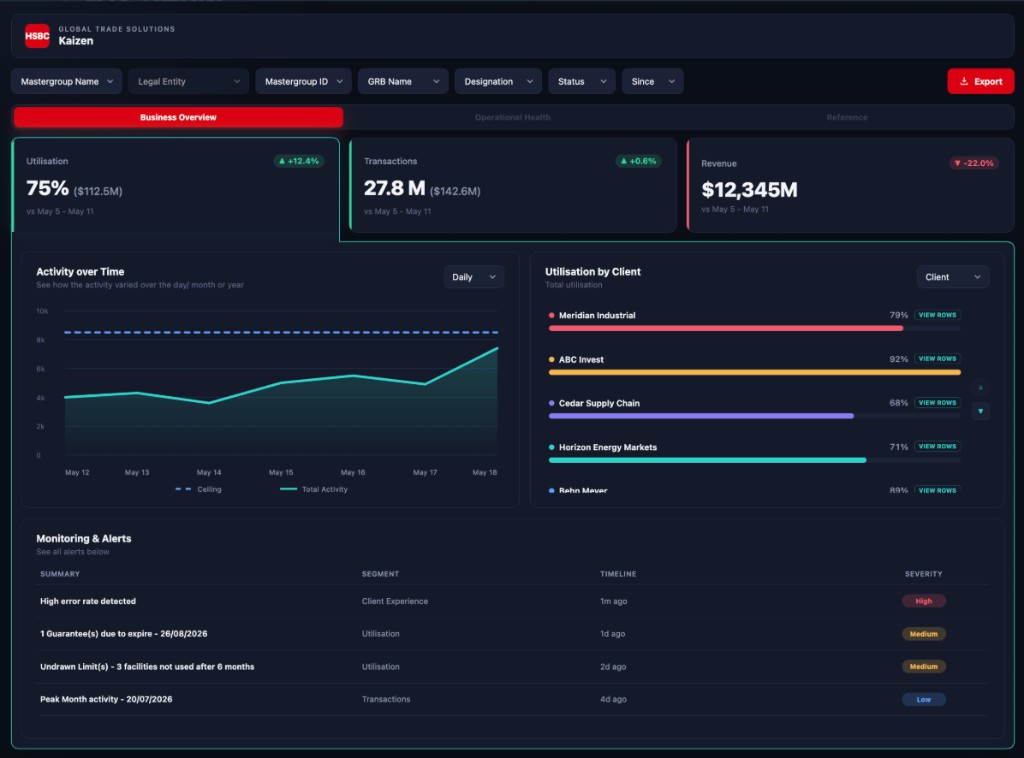
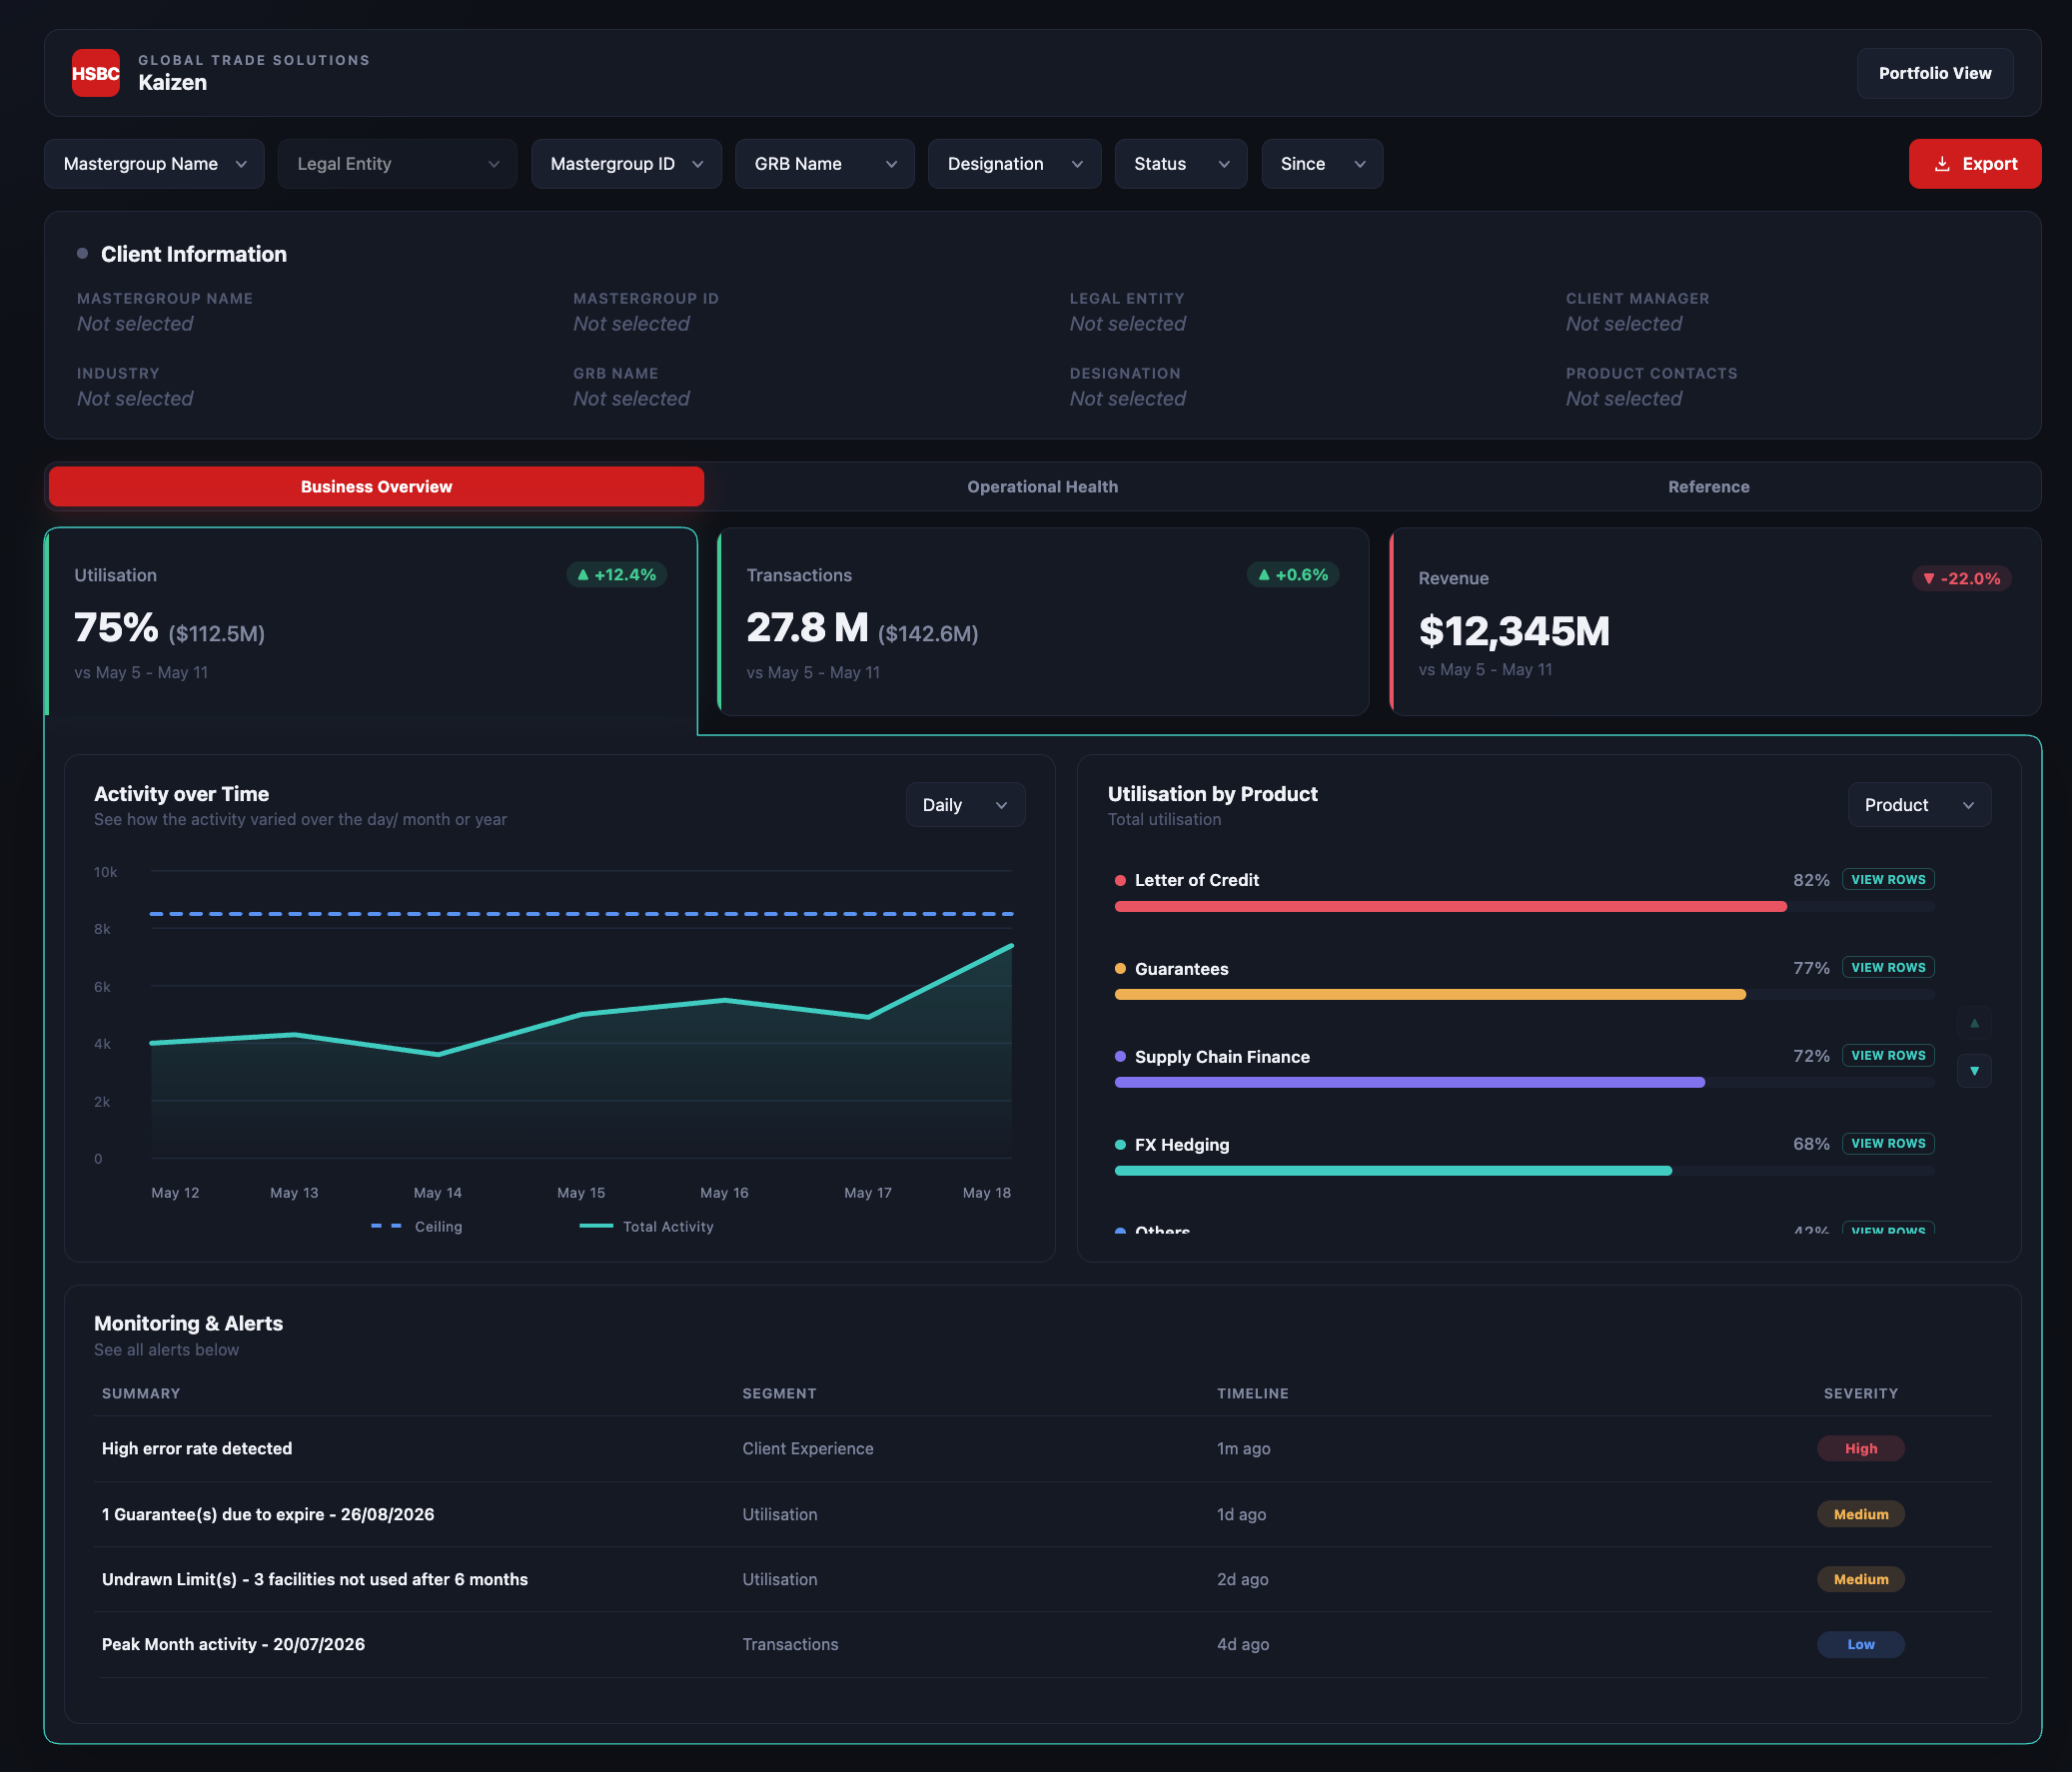
Kaizen is a Global Trade Solutions dashboard I built for HSBC to help review client and portfolio performance in one place. It brings together commercial KPIs, operational health metrics, client information, activity trends, product and portfolio breakdowns, alerts, and exportable supporting data so users can move from a headline number to the detail behind it without leaving the page.
The dashboard is designed around a top-down workflow: users start by selecting filters such as mastergroup, legal entity, GRB name, designation, status, and reporting period, then read the KPI cards, charts, breakdowns, and monitoring alerts that update from those choices.
For this portfolio, Kaizen is shown with fake demonstration data only. No real HSBC client, transaction, revenue, limit, operational, relationship, or confidential business data is included, in order to respect HSBC privacy and confidentiality.
Technology Stack
Screenshots
Business Overview Dashboard
The dashboard view used for the portfolio entry, showing the HSBC-branded Kaizen interface with filter controls, client information, KPI cards, analytics panels, and monitoring alerts. The figures shown are fake demonstration data.
Portfolio View
The portfolio-level view, used to compare performance across clients and monitor alerts at a broader level. In this view, Operational Health and Reference are muted so the focus stays on Business Overview. This screenshot also uses fake demonstration data only.